A report can give you an overall view of the data recorded by your Bindelo device in an organized way which is very easy to understand and remember. This report can be a graphic illustration, a gauge indicator or a table, or a combination of all these three. The report can show statistic information of the recorded data too.
To create a report, you will have to follow some easy steps:
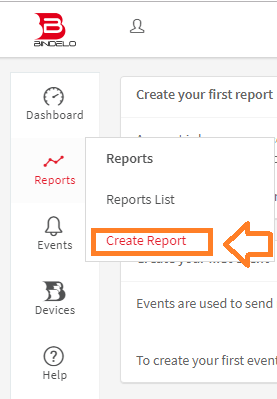
Step 1: Log into your Bindelo account and click on “Reports” from the main menu of the dashboard, and then click on “Create Report”.
Step 2: Then you will be asked to enter some Basic Information about the report you wanted to generate, such as:
1. Report Name. It will be shown as the report title.
2. A brief description of your report. See the below image as a sample. This is an optional field.
3. Writing tag or keywords so you can find your report effortlessly in the future. It’s also useful to make a group or classify your reports.
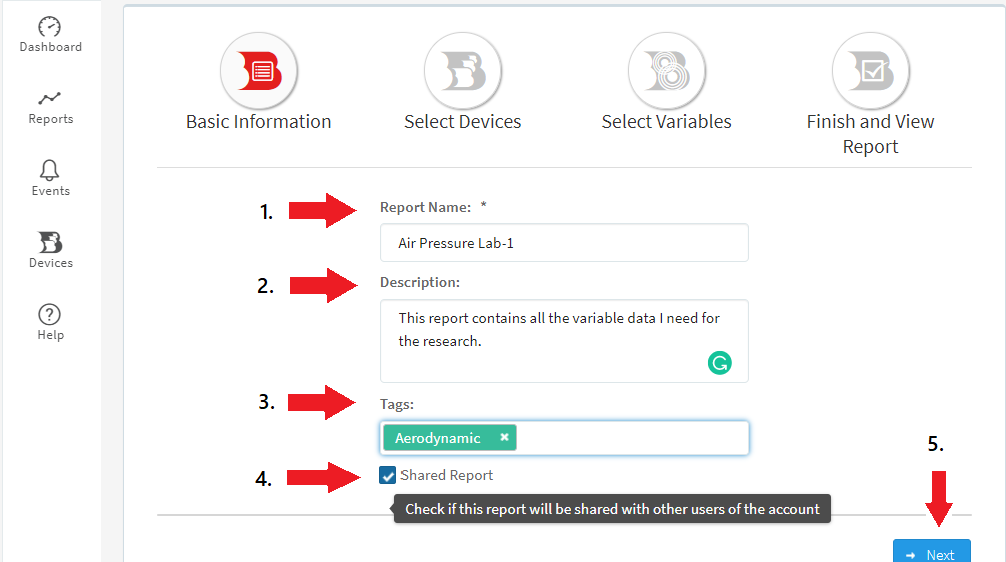
4. If you want to share your report with other users of the same Bindelo account, then click here.
5. After finish with the basic report information, click on the Next button.
Step 3: in the next page, you will find all your devices listed here, so you can select which of them will be included in the report. You may use the search field to enter the name or the tags of the device you like to create the report of.
To select a device, check the upper left corner and tick the box beside the device name (red marked on the following image), here in the sample the device name is: Room#1. Please note, you can select multiple devices at a time.
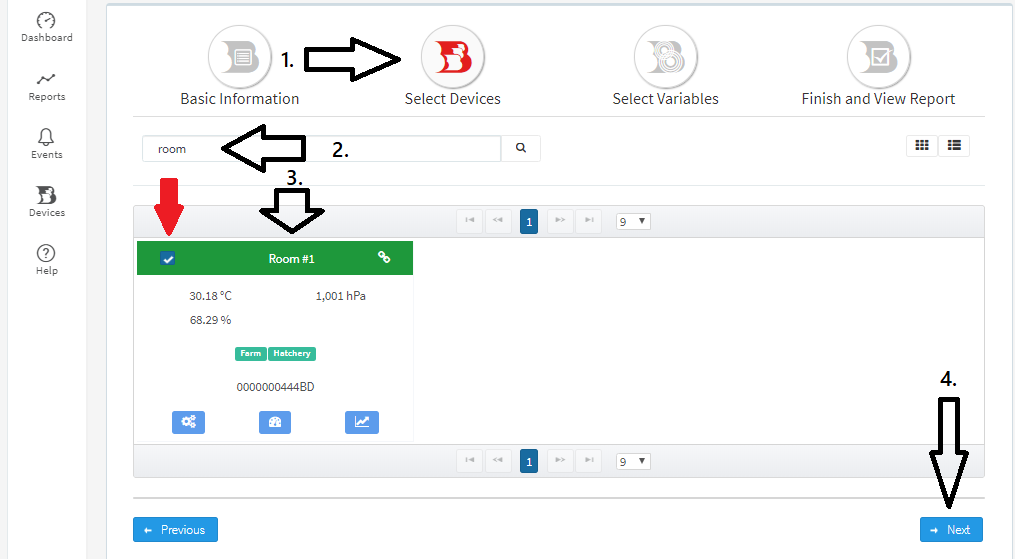
And then click Next (numbered 4).
Step 4. After selecting the devices, you will find two tabs in the window named Variables Table & Status Table.
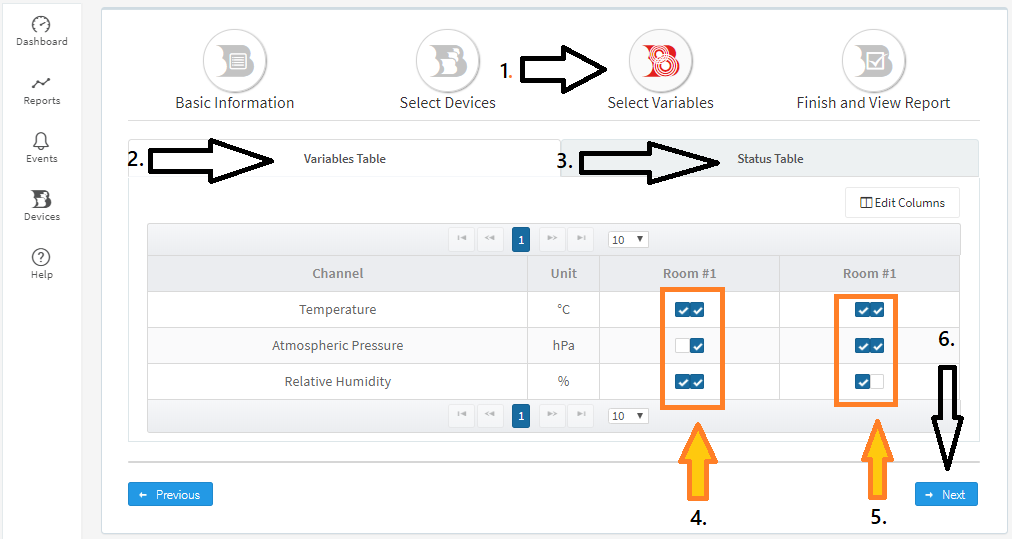
Here you can select all the variables that you would like to include in your report by checking the box of each one. (Yellow marked). And then click Next.
Step 5. After the selection of the variables, you can select what kind of report are you going to create. You can select the time (numbered 2 & 3 of the bottom image) from this page, for which date range you want your report to be generated in. The “Time” combo box will list the laps of time shown on the report, this time-lapse may be modified at any time after the report is created. You can select any option from the list on the left side (numbered 4) as well. Here we will be seeing 3 types of parameters:
i) Create Graph
ii) Create List
iii) Create Indicator
And on the right side, you will be able to see the generated report based on your preferences.
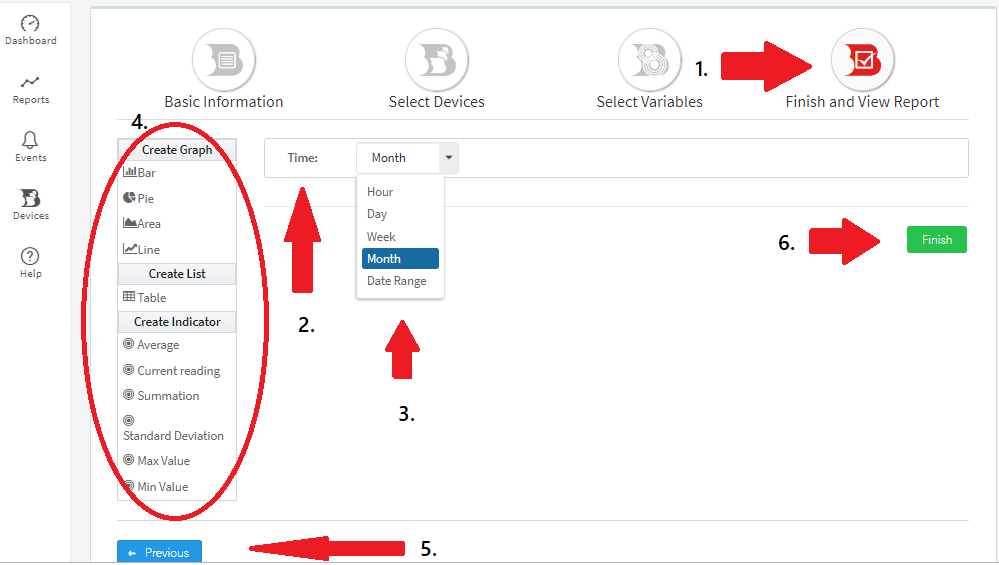
You can go to the previous page any time to change or edit any previously entered data (numbered 5). If you are finished with all these, proceed to the Finish button (numbered 6).
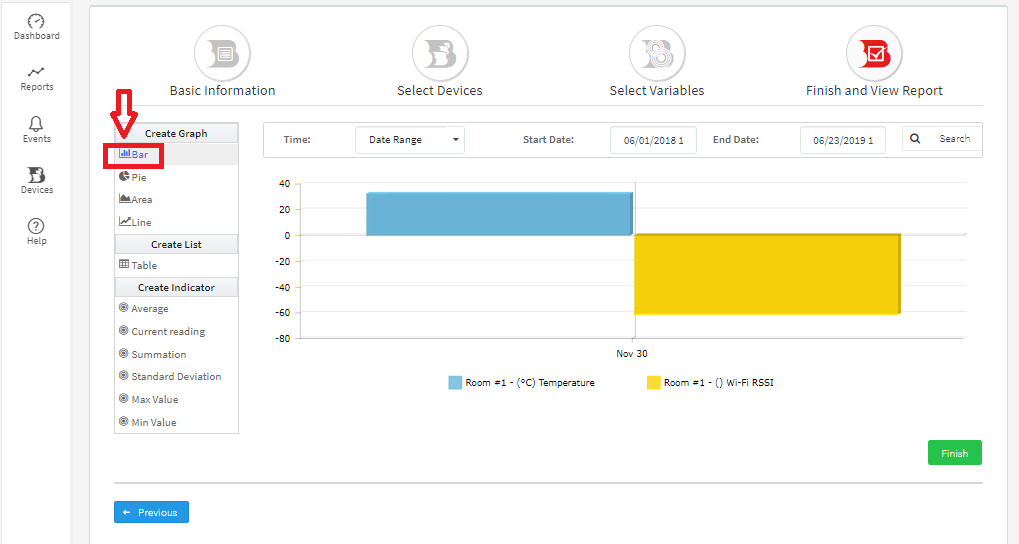
Step 6. If you select “Bar” from the left side panel, the following-like report will be shown on the screen.
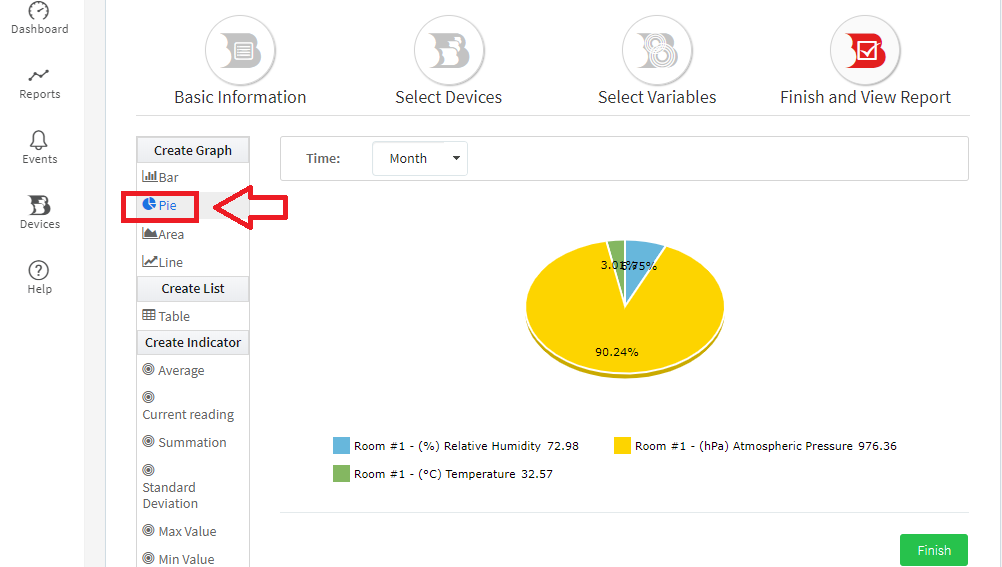
If you select “Pie”, it will look like this:
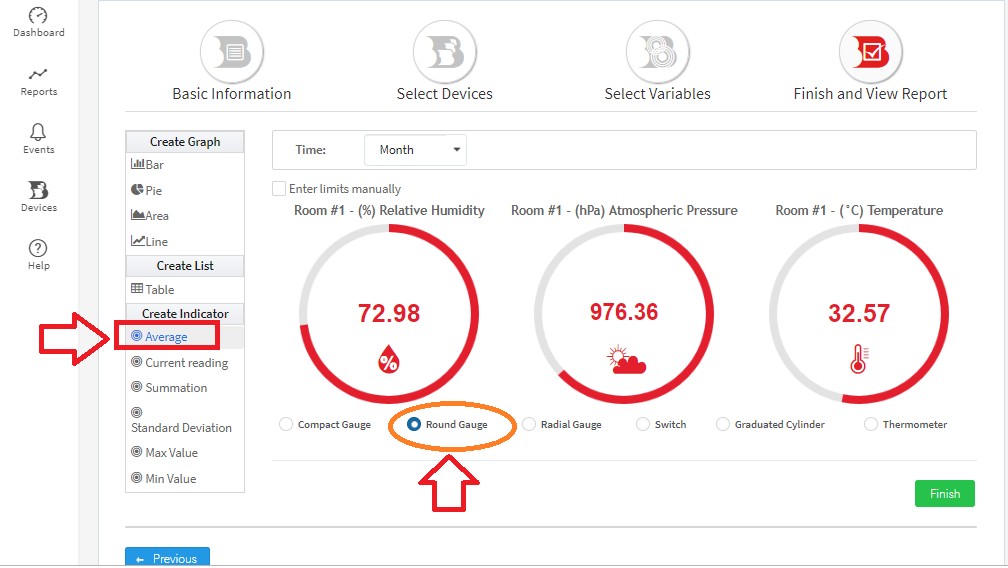
If you want to create indicators and see the report in “Round Gauge“, for example, then click any button from the “Create Indicator” part (the following images shows “average”) and select your preferred reporting output style, then the following window will be generated.
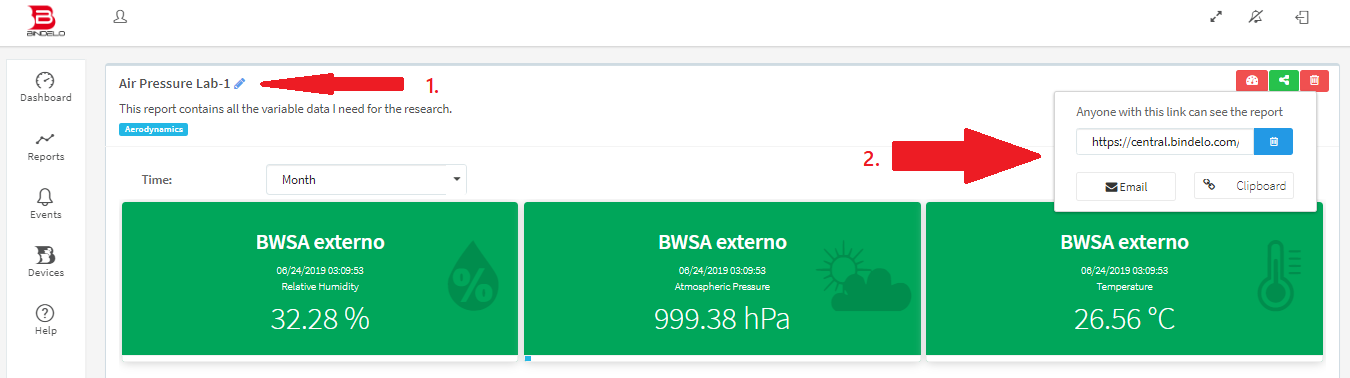
You can edit your report anytime by clicking the “edit” icon here. (numbered 1 on the below image). You can also share your report from this link to social media, which also can send via email (numbered 2 on the below image).
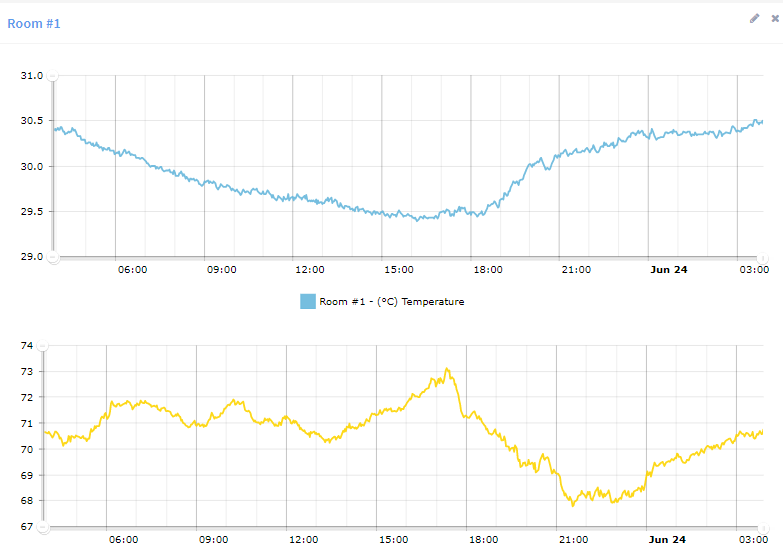
You can also view the report as the line graph, right on the report page itself.
Step 7: You can also export the report in different file formats, such as PDF, Excel, CSV, and XML. Notice the following image for details, and read the descriptions below it.
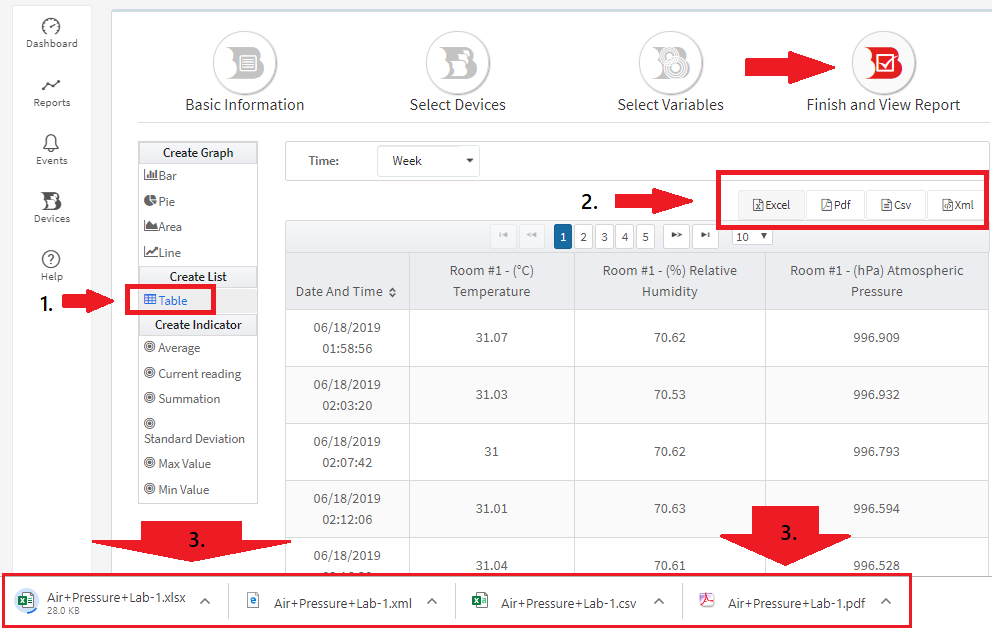
1. Click on “Table” first
2. Select your desired file format.
3. The file will be downloaded to your PC in no time.
Thus you will be able to export your reports in these 4 popular and most used file formats. If you still have trouble creating the report, please feel free to contact us at any time.